> ## Documentation Index
> Fetch the complete documentation index at: https://promptlayer-hasaan-mcp-docs.mintlify.site/llms.txt
> Use this file to discover all available pages before exploring further.
# Overview
> Inspect individual model calls, including their content, status, usage, cost, and metadata.
A request log records one model call. Use it to inspect exactly what your application sent and received, diagnose a failure, review latency and token usage, or connect production behavior to a prompt template.
Each request log can include:
* Model input and output
* Provider and model
* Start time, end time, and latency
* Input and output tokens
* Estimated cost
* Status and error details
* Prompt template association
* Tags, metadata, scores, [Signals](/features/observability/request-logs/signals), and a PromptLayer request ID
## View Request Logs
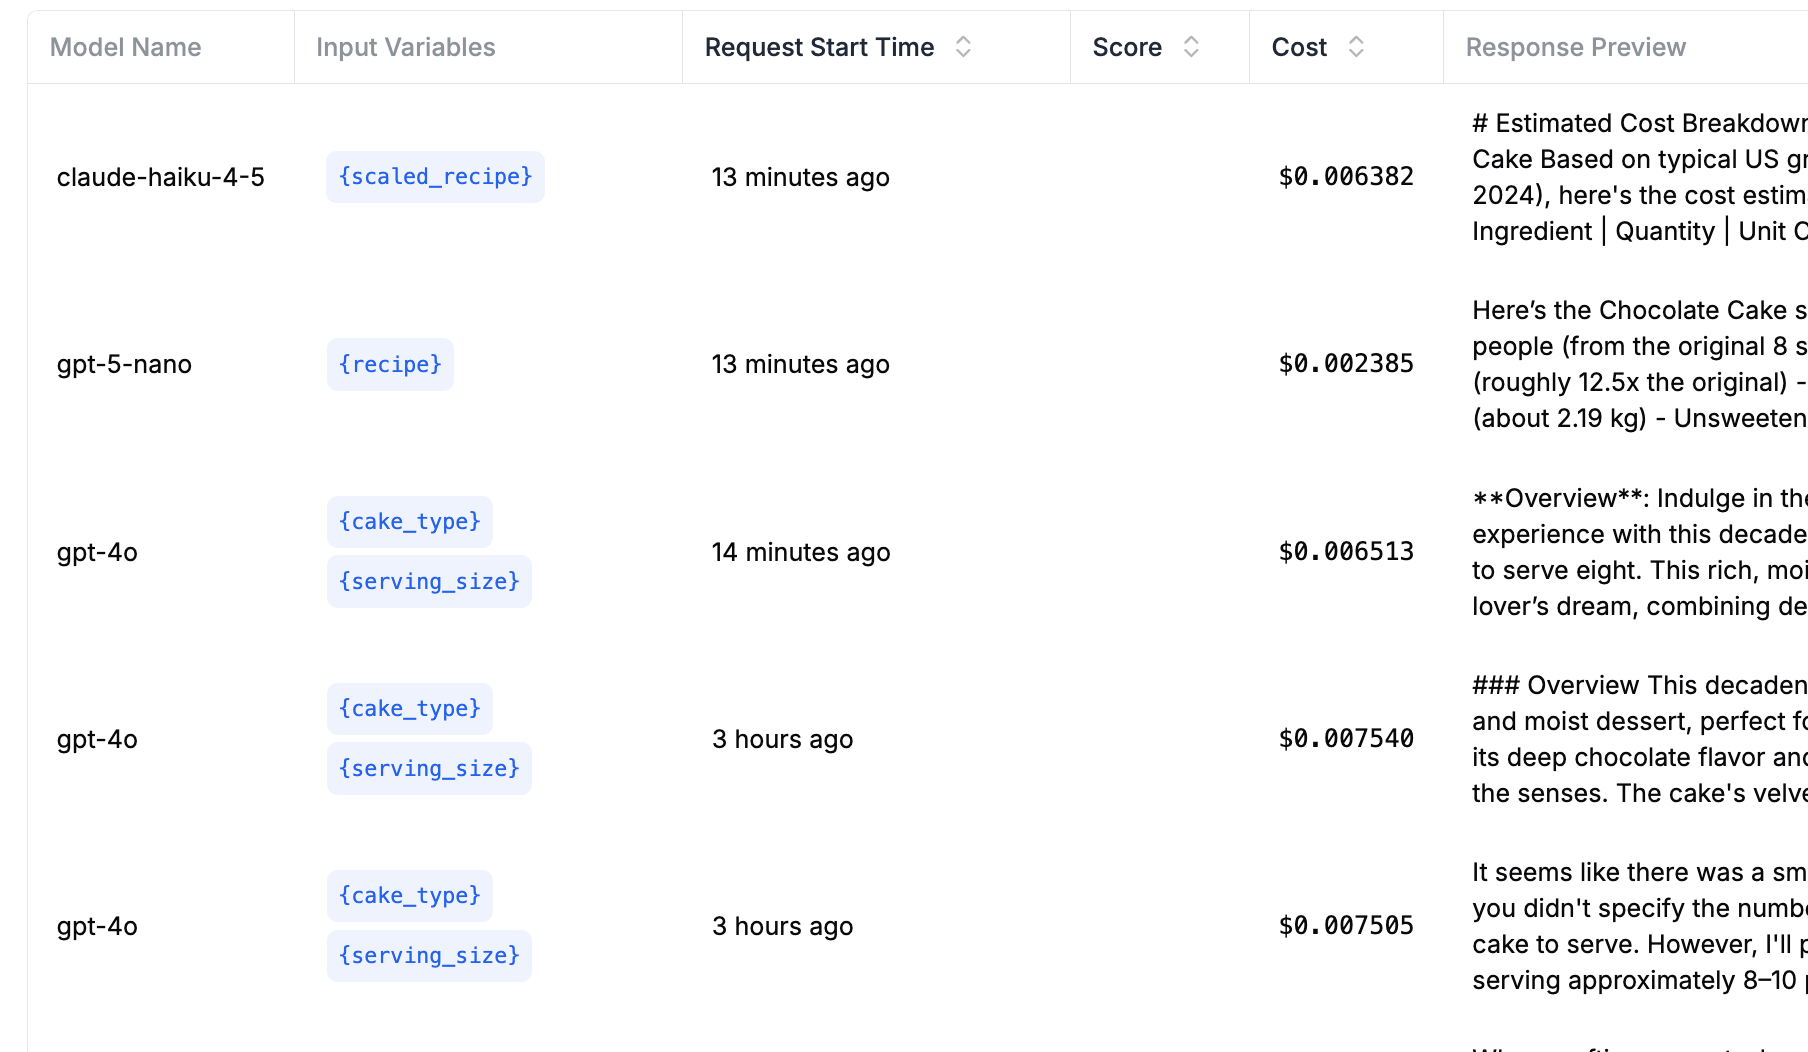
Open **Request Logs** in the PromptLayer sidebar. The Requests table shows the model, prompt, status, timing, token usage, cost, and other fields for each call. Select a row to open its full details.
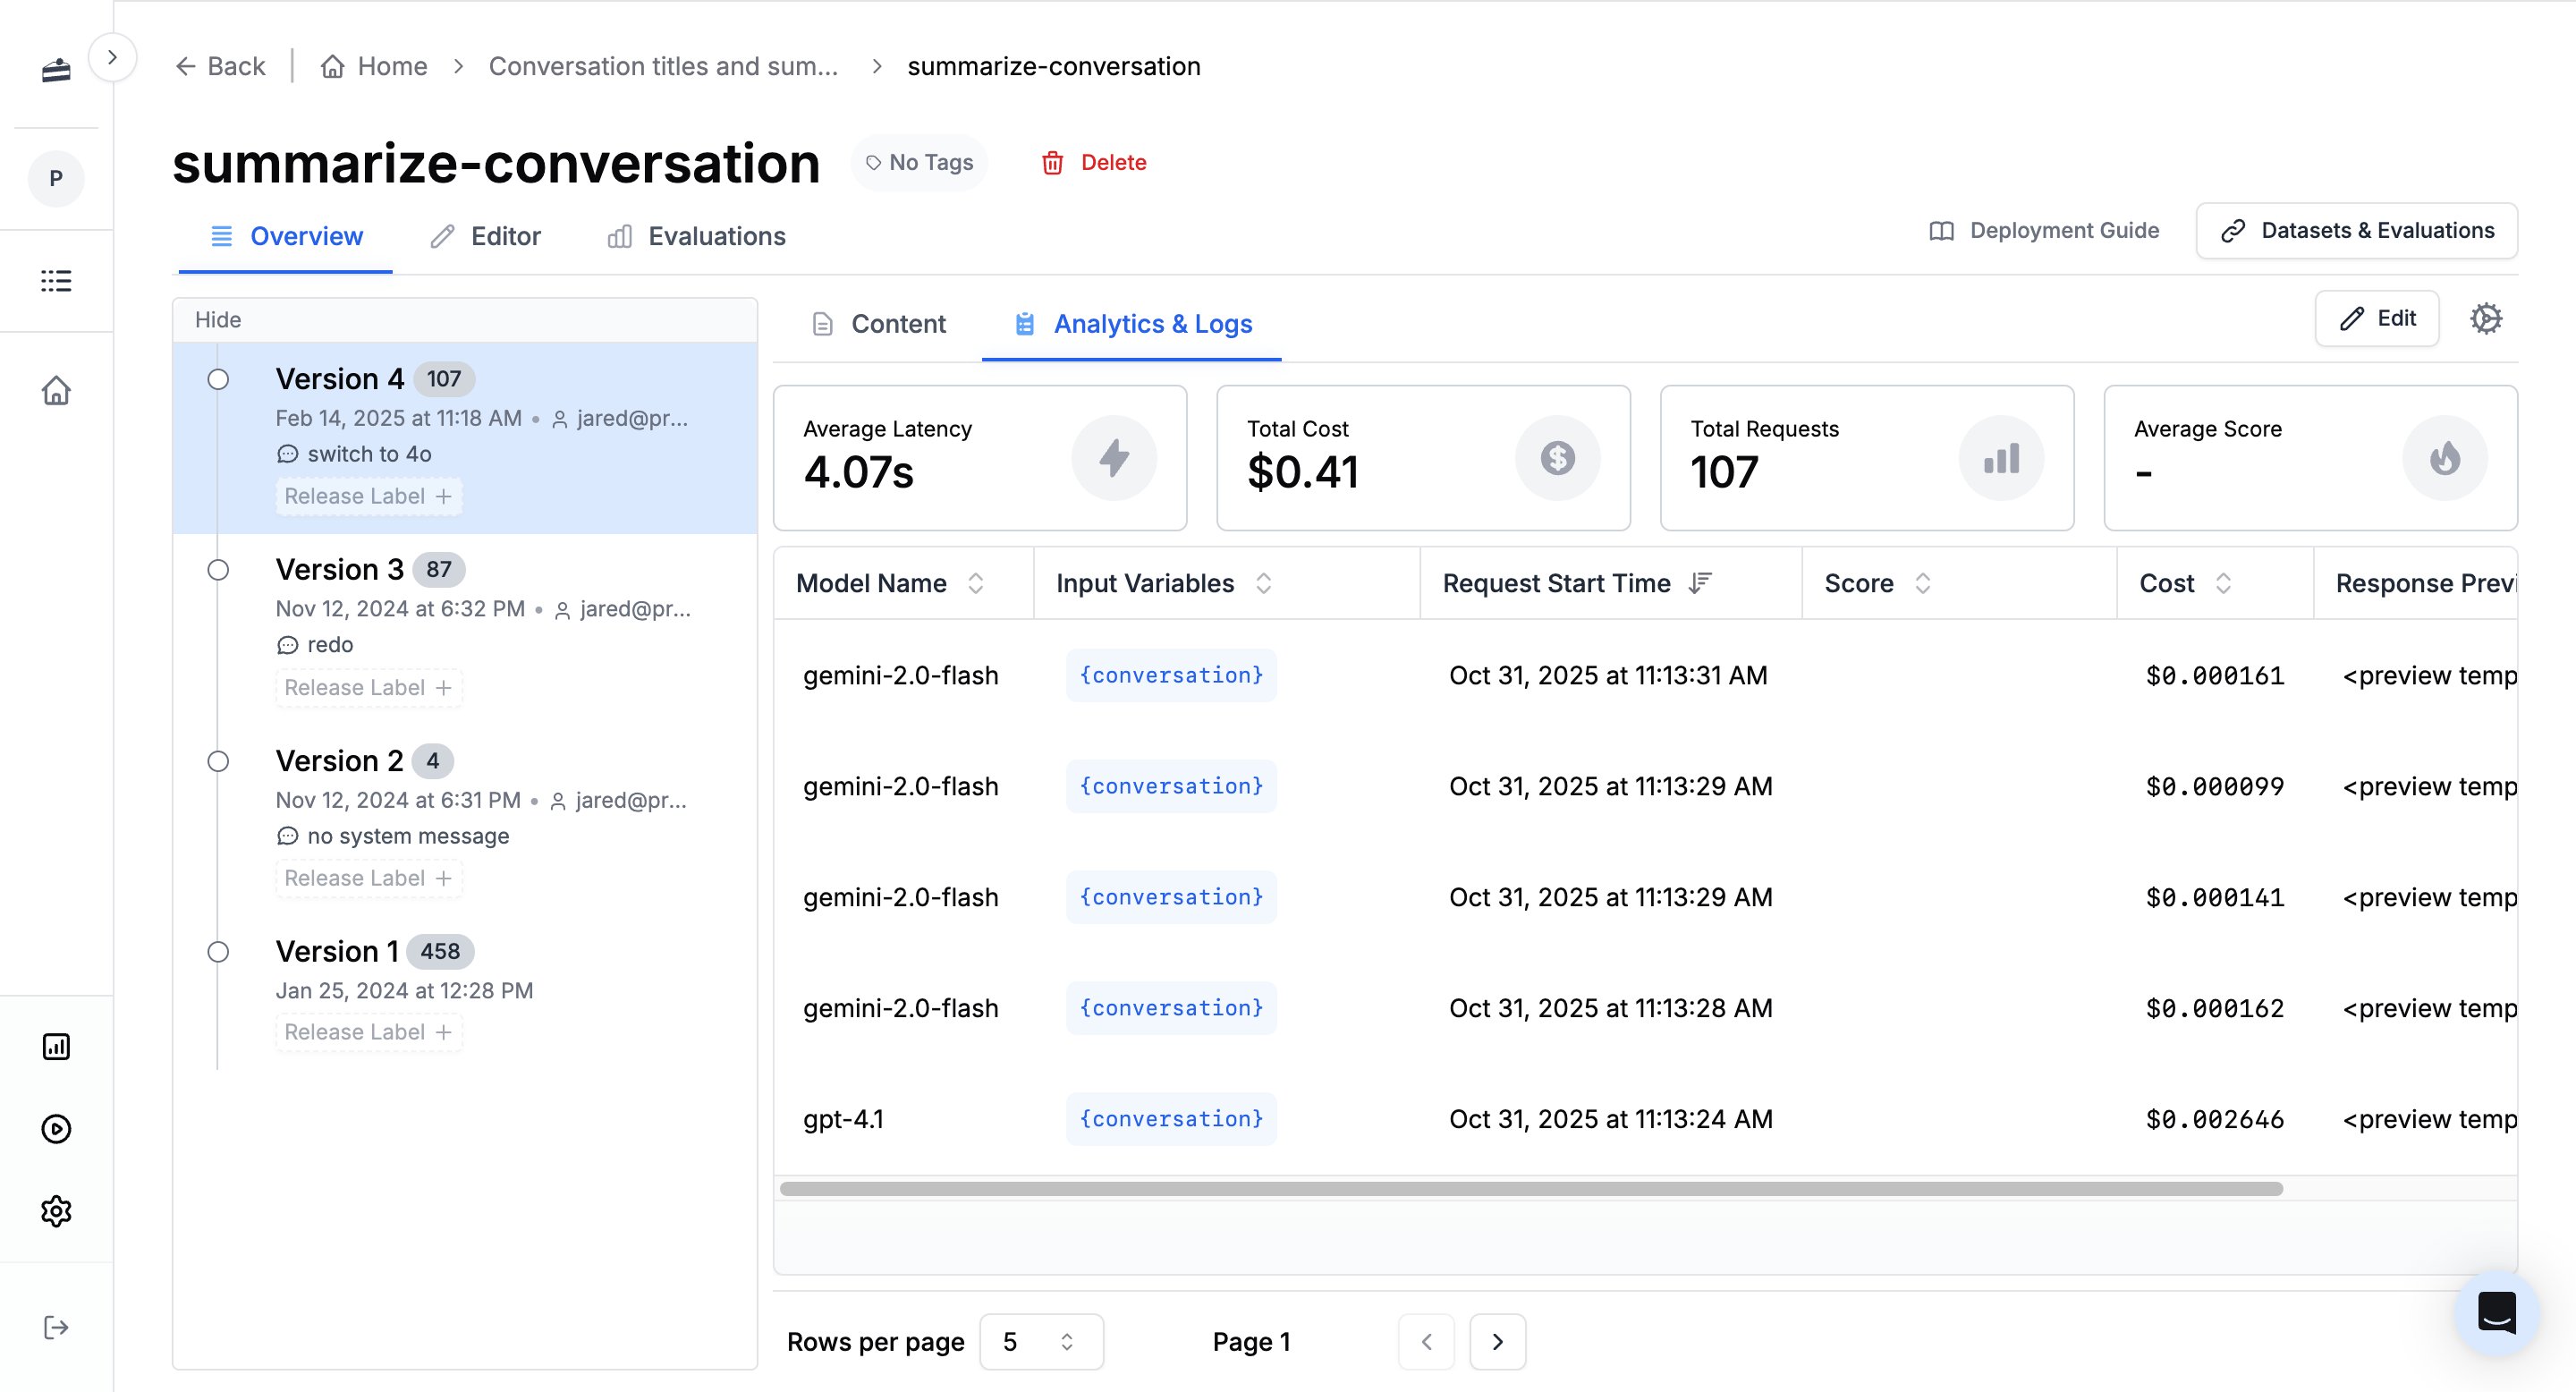
 To review logs for one prompt, open that prompt and select **Analytics & Logs**.
 ## Find a Request
Use the date range, free-text query, and structured filters above the Requests table. You can filter by fields such as prompt, model, provider, status, tags, metadata, [Signals](/features/observability/request-logs/signals), content, latency, tokens, and cost.
See [Search](/features/search-and-analytics/search) for the dashboard workflow, supported filter categories, and older-data behavior.
## Request Logs and Traces
A request log describes one model call. A [trace](/features/observability/traces) describes the complete operation around that call and can contain multiple request logs.
When PromptLayer receives a supported GenAI span, it creates a request log for the model call and links it to the trace. If `PromptLayer.run()` already created the request log, PromptLayer links the span to that log instead of creating a duplicate.
## Configure Request Logs
Use [tags](/features/observability/request-logs/tags), [metadata](/features/observability/request-logs/metadata), [scores](/features/observability/request-logs/scores), and [Signals](/features/observability/request-logs/signals) to make requests easier to find and compare. Every log also has a [PromptLayer request ID](/features/observability/request-logs/request-ids) that you can store or use with tracking methods.
Use [Tracking Templates](/features/observability/request-logs/tracking-templates) to associate provider calls with PromptLayer prompts. For manual provider calls or unsupported models, use [Custom Logging](/features/observability/request-logs/custom-logging). If a provider returns JSON, see [Structured Outputs](/features/observability/request-logs/structured-outputs).
## Reuse Production Data
Select request logs from the table and add them to a [PromptLayer Table](/features/tables/overview#import-data). This lets you turn representative production examples or failures into evaluation and backtesting data.
## Find a Request
Use the date range, free-text query, and structured filters above the Requests table. You can filter by fields such as prompt, model, provider, status, tags, metadata, [Signals](/features/observability/request-logs/signals), content, latency, tokens, and cost.
See [Search](/features/search-and-analytics/search) for the dashboard workflow, supported filter categories, and older-data behavior.
## Request Logs and Traces
A request log describes one model call. A [trace](/features/observability/traces) describes the complete operation around that call and can contain multiple request logs.
When PromptLayer receives a supported GenAI span, it creates a request log for the model call and links it to the trace. If `PromptLayer.run()` already created the request log, PromptLayer links the span to that log instead of creating a duplicate.
## Configure Request Logs
Use [tags](/features/observability/request-logs/tags), [metadata](/features/observability/request-logs/metadata), [scores](/features/observability/request-logs/scores), and [Signals](/features/observability/request-logs/signals) to make requests easier to find and compare. Every log also has a [PromptLayer request ID](/features/observability/request-logs/request-ids) that you can store or use with tracking methods.
Use [Tracking Templates](/features/observability/request-logs/tracking-templates) to associate provider calls with PromptLayer prompts. For manual provider calls or unsupported models, use [Custom Logging](/features/observability/request-logs/custom-logging). If a provider returns JSON, see [Structured Outputs](/features/observability/request-logs/structured-outputs).
## Reuse Production Data
Select request logs from the table and add them to a [PromptLayer Table](/features/tables/overview#import-data). This lets you turn representative production examples or failures into evaluation and backtesting data.